Development of a Method for Analysis of Phthalate Esters in Vegetable Oils
Luigi Mondello
Analytical Chemistry/Food Chemistry Laboratories, University of Messina, Italy,
Direct-Immersion SPME followed by Fast GC with Triple Quadrupole MS Detection
Introduction
Phthalates (PAEs) are a group of synthetic compounds mainly used as plasticizers. They have been classified as endocrine-disrupting chemicals and potential human cancer- causing agents1. PAEs present in plastic materials can be lost over time since they are not chemically bound to the polymeric matrix. They can be found in high amounts in foods primary due to direct migration from packaging films. Fatty foods are especially susceptible because of the lipophilic nature of PAEs. No regulations about PAE content in food currently exist, but European Union Directive 2007/19/EC discusses PAE migration from food contact material and lists the substances allowed in such materials. Due to PAEs ubiquity, their analytical determination is very challenging2,3. A method with minimal sample manipulation is highly desirable. Many methods have been proposed to analyze PAEs in foods and vegetable oils, mainly followed by a gas chromatographic-mass spectrometric (GC/MS) determination. The main objective of any sample preparation for PAE analysis is basically to remove triacylglycerols (TAGs) and free fatty acids interferences4,5. An alternative method proposes a modification of a traditional PTV GC injector to introduce diluted oil into the liner, vaporizing the PAEs and leaving TAGs in the injector. The TAGs are removed in backflush mode through the split exit6. Headspace solid-phase microextraction (HS-SPME) has been also investigated to minimize sample manipulation in the preparation step for PAEs analysis in vegetable oils, but the quantification limits were not very low7,8. The aim of this work was to develop and optimize a rapid and simple SPME method, minimizing sample manipulation, followed by a fast GC-triple quadrupole MS (QqQ) determination.
Experimental
A stock solution (10,000 mg/L) containing 10 PAEs was prepared. The abbreviation for each PAE appears in Table 1. Because of the lack of edible oil or fat standards certified for plasticizers, a sample of extra virgin olive oil (EVO) was spiked with 2 mg/kg of the PAE standard solution and used for method optimization. Special care was taken with solvents, glassware, caps, and septa to avoid contamination before use.
The optimized sample preparation and analysis procedures appear in Figure 1. Multiple reaction monitoring (MRM) acquisition mode was applied using the transitions listed in Table 2, optimized by injecting liquid standard PAE solutions. Eight vegetable oils (two extra virgin olive oils (EVO), one olive oil, one peanut oil, two sunflower oils, one soy oil, one mixed seeds oil), purchased from a local market in Messina, Italy, were then prepared and analyzed by this procedure.

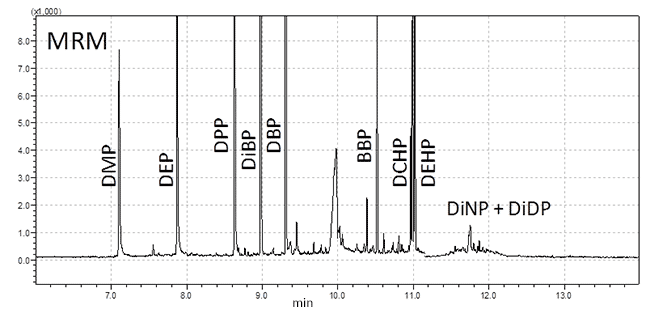
Figure 1.GC/MS MRM chromatogram of extra virgin olive oil spiked with PAEs.
Conditions
Sample/matrix: 0.5 g extra virgin olive weighed into a 10 mL glass centrifuge tube, spiked with phthalate esters at 2 mg/kg, 3 mL acetonitrile added, vortexed 30 sec, centrifuged 10 min at 3000 rpm, 1.5 mL acetonitrile from the top transferred to a 2 mL vial; SPME fiber: 100 µM PDMS (Product No. 57300-U); extraction: direct-immersion, 20 min, constant stirring at 500 rpm; desorption process: 280 °C for 5 min, splitless
column: SLB-5ms, 10 m x 0.10 mm I.D., 0.10 µM (Product No. 28465-U); oven: 90 °C (5 min), 30 °C/min to 310 °C, 50 °C/min to 350 °C (3 min); inj. temp.: 280 °C; carrier gas: helium, 50 cm/sec; detector: MS (triple quadrapole), 220 °C, ESI(+), MRM, 70 eV; MSD interface: 280 °C
Results and Discussion
Method Optimization
The low-polarity SLB-5ms GC column employed provides baseline separation of all target PAEs, except for the DiNP and DiDP, which partially co-eluted due to the presence of many isomers. An MRM chromatogram of a spiked EVO sample is shown in Figure 1. DiNP and DiDP were present as partially co-eluted peaks due to the presence of many isomers; therefore they were quantified together as a sum.
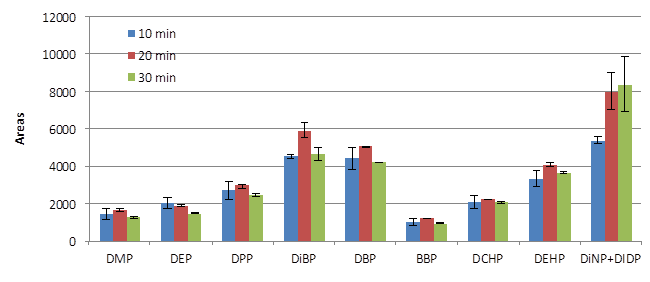
The direct immersion (DI) SPME step was optimized around sample extraction time, desorption time, desorption temperature, and the ratio of oil to acetonitrile. In particular, different sample extraction times, namely 10, 20, and 30 minutes, were tested (Figure 2). The extraction efficiency and the repeatability values (n=3) were much better using a 20 minute extraction time. Moreover, considering the 16 minute GC run time, plus a few minutes to permit cooling of the system prior to the next injection, a 20 minute fiber extraction time was the perfect choice to synchronize the sample preparation time with the instrument run time.
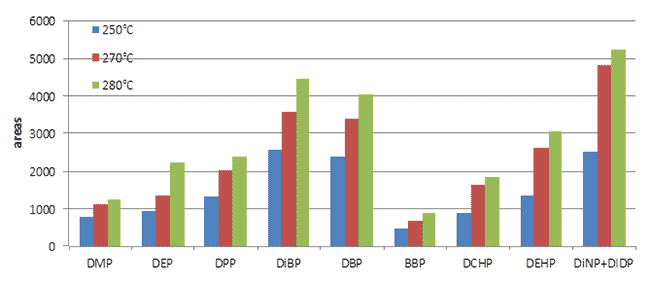
Various temperatures, 250, 270, and 280 °C, were tested during optimization of the temperature used to desorb the fiber in the injector. Desorption at 280 °C gave higher signals and guaranteed no carry-over effect (Figure 3). Finally, different amounts of oil, specifically 0.5 and 2 g, were extracted with 3 mL acetonitrile to optimize the oil/solvent ratio. Data suggested a less favorable partition ratio between oil and solvent using 2 g of oil in 3 mL of acetonitrile. Although both amounts can be used, 0.5 g was maintained as the sample amount to minimize sample consumption, optimize the partition ratio, and extend the dynamic range.

Figure 2.Effect of SPME fiber extraction time on PAE recovery.

Figure 3.Effect of SPME fiber desorption temperature on PAE recovery.
Method Validation
A 6-point calibration curve (n=3) was constructed by analyzing a spiked EVO sample at increasing concentrations ranging from 0.02 to 10 mg/kg. Good correlation (R2), in the range 0.9971 – 0.9994, was obtained. Values were corrected according to the blank amount found in the EVO oil. A 2 mg/kg spiked EVO sample was analyzed six times over two days (three replicates per day) to assess intra-day and inter-day repeatability (CV%). CV% values below 10% were obtained for all PAEs except for DiNP+DiDP (inter-day repeatability of 11.9%). The relative error deviation between the values obtained from the analysis of a spiked sample (4 mg/kg) and the expected values was calculated to assess the accuracy (A%). Accuracy values were below 10% for all PAEs, except for DiBP and DiNP+DiDP (10.2 and 11.8%, respectively). In Table 3, the method performance characteristics are summarized along with the quantification limits (LOQ) values, evaluated both as 10-times the signal-to-noise ratio (S/N) and according to the Eurachem Guidelines9. The evaluation of LOQ values by using S/N is mainly related to the specific method applied, but it does not consider the unavoidable blank problem due to the ubiquity of PAEs. Therefore, the LOQs were also calculated according to the Eurachem Guidelines, which suggest the following formula to evaluate similar situations:

where σb is the standard deviation of a blank sample, n is the number of replicate observations averaged when reporting results, and nb is the number of blank observations used to calculate the blank correction.
Real Vegetable Oil Samples
The DI-SPME-GC QqQ MS optimized method was applied to analyze PAEs in different types of vegetable oils. Table 4 shows the amount of the various PAEs (expressed as average of two replicates), after subtracting the contamination derived from the sample preparation procedure, along with information on packaging material. Samples packed in plastic bottles showed generally higher amounts of PAEs. Olive oil samples presented relatively high amount of DEHP and DiNP+DiDP with respect to that found in seed oils. Among seed oils, the most contaminated was the mixed seed oil, followed by the soybean and peanut oil.
Conclusion
A rapid, easy, and sensitive method for the analysis of PAEs in vegetable oils was developed and presented here. After a rapid LLE extraction method to remove the bulk of TAGs, the application of the PDMS SPME fiber in direct immersion (DI) mode gave good performance characteristics in terms of linearity, repeatability, accuracy, and limit of quantification. The method is robust: No change in column performance (selectivity, efficiency) was observed after more than 300 analyses.
Legal Information
SLB is aregistered trademark of Sigma-Aldrich Co. LLC
References
如要继续阅读,请登录或创建帐户。
暂无帐户?