Counting Yeast Cells for Brewing and Wine Industries Can Be Facilitated by the Scepter™ 2.0 Handheld Automated Cell Counter
Introduction
During fermentation, carbohydrates present in the wort (a water-based solution of grain sugars) are converted by yeast into alcohol, carbon dioxide, and numerous byproducts. There are several stages in the process at which analysis of the active yeast culture is advantageous. The first, and most critical point for cell enumeration, is during the pitching process. Pitching is the first step of fermentation, in which a live yeast culture is introduced into the wort (Figure 1). Introduction of a consistent cell concentration is required for successful fermentation, as well as to maintain batch-to-batch reproducibility. In addition, samples are often taken during fermentation proper. During this process, yeast cells undergo budding. As shown in Figure 1, yeast sampling is also done at the end of the fermentation process; recovery of yeast from the final product permits re-pitching (re-use of a single yeast stock). These samples will be significantly more complex than the starting content due to accumulation of protein. If not eliminated, this protein may interfere with accurate counting. Consistent harvesting and repitching practices ensure consistent yeast performance over many cycles of fermentation.
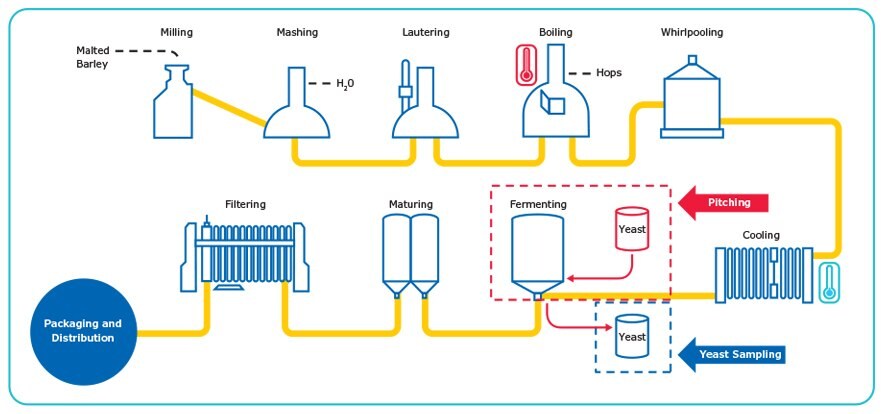
Figure 1. The Brewing Process.Accurate counting of yeast cells is important during the pitching and sequential yeast sampling steps.
The Scepter™ cell counter offers an easy-to-use alternative to current methods for counting yeast cells. The Scepter™ cell counter combines the ease of automated instrumentation with the accuracy of impedance-based counting using the Coulter principle in an affordable, handheld format (Figure 2). The instrumentation has been collapsed into a device the size of a pipette and uses a combination of analog and digital hardware for sensing, signal processing, data storage, and graphical display in the form of a histogram. The 40 μm- and 60 μm-aperture sensors are engineered with a microfabricated sensing zone that enables discrimination by cell size and sample volume at sub-micron and sub-picoliter resolution, respectively. Here, we outline the method for using Scepter™ counting for the enumeration of yeast cells..
Materials and Methods
Yeast Culture:
10 mg of dehydrated Saccharomyces cerevisiae (ATCC #7754) was added to 500 μL H2O, vortexed 15 sec, and incubated for 5 min at room temperature to rehydrate. 100 μL of this stock was then used to initiate a culture in 250 mL Sabouraud dextrose broth. The culture was grown in a shaker (265 RPM) for 20 hours at 30 °C. At the end of this incubation, a 50 mL aliquot was centrifuged, and the pellet was re-suspended in 50 mL phosphate-buffered saline (PBS). Using the Coulter Counter® (Beckman Coulter), an initial concentration was determined for this sample. Theoretical concentrations were determined by dividing the initial concentration by dilution factors. The sample was then diluted to 1.5 x 10⁶ cells/mL and subsequent serial dilution in PBS was performed. PBS is at an optimal salt concentration for appropriate conductivity required for accurate counting performance. For each test, we used the recommended sample volume of 100 μL in a 1.5 mL microcentrifuge tube. Other tubes may not accommodate the width of the sensor, or provide sufficient sample depth for the instrument to function properly. Since cells settle quickly, we kept the yeast cells well mixed in suspension to ensure reproducible counts.
Scepter™ Cell Counting:
Operation of the Scepter™ cell counter is similar to using a standard laboratory pipette. The Scepter™ cell counter is turned on by depressing and holding the toggle on the back of the instrument. Once on, the instrument will prompt the user to attach a sensor. The Scepter™ unit displays detailed on-screen instructions for each step of the counting process. Briefly, depress the plunger and submerge the sensor into the solution. Next, release the plunger to draw 50 μL of cell suspension into the sensor. The Scepter™ cell counter detects each particle passing through the sensor’s aperture, then calculates concentration and displays a histogram of cell diameter or volume on its screen.
Scepter™ Data Analysis:
The upper and lower limits of the histogram, called gates, are either set automatically based on the histogram profile, or can be set to the same gates used in the previous count. After the count is complete and the histogram is displayed on the instrument, the gates can be moved manually to fine-tune the analysis. Up to 72 histograms can be stored on the instrument itself. All test data files can also be uploaded to a computer and further analyzed using Scepter™ Software Pro.
Other Counting Methods:
For comparative studies, counts were also performed using the Z2 Coulter Counter® (Beckman Coulter) according to manufacturer’s instructions, using the same starting suspension and serially diluted samples.
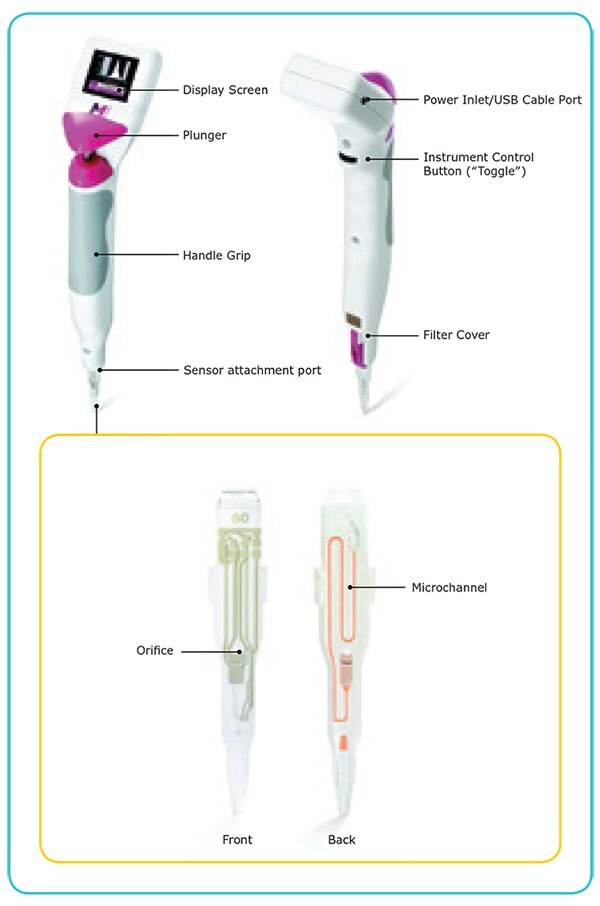
Figure 2.Scepter™ cell counter and sensor
Results
Samples of varying concentrations from a single overnight culture were used to assess the feasibility of counting yeast with a Scepter™ cell counter fitted with 40 μm aperture sensors. For all concentrations tested, yeast samples yielded interpretable histograms that could be gated and used to calculate yeast size and concentration. Examples of these histograms are shown in
Figure 3.
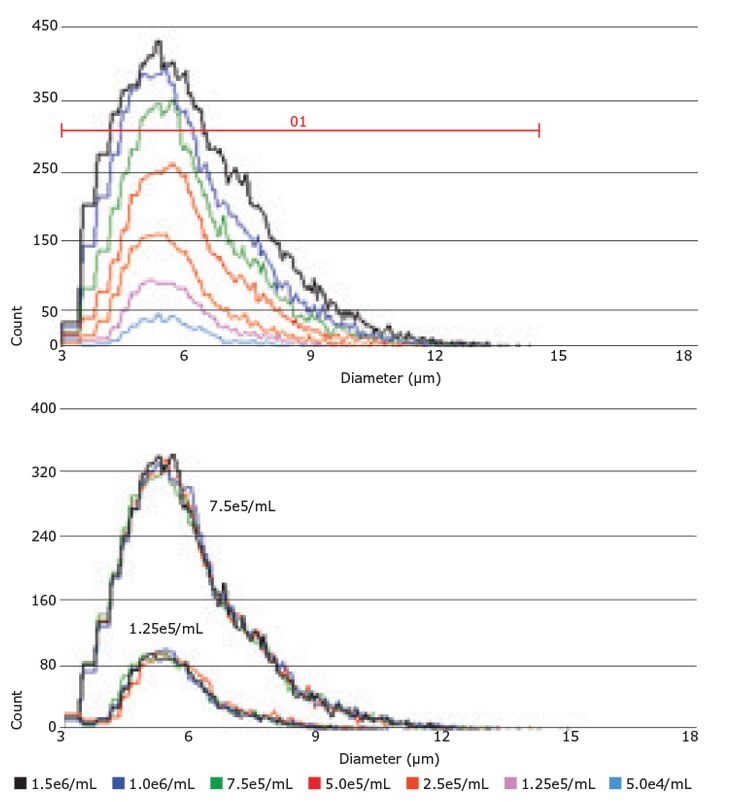
Figure 3.Scepter™ Software Pro permits yeast cell analysis and display of single samples, or in batch format through histogram overlays. The plot on the top is an overlay of histograms from each of the 7 steps in the dilution series. On the bottom, 4 replicates at each of two concentrations have been overlaid to demonstrate measurement reproducibility.
Comparative Performance
To assess the range and linearity of the Scepter™ cell counter’s performance, we plotted the measured concentration values (mean of 4 replicates) versus the corresponding theoretical concentrations across the dilution range. Identical samples were tested in parallel on the Coulter Counter® (Figure 4). While both instruments demonstrated high linearity in sample counting (Scepter™ R2 = 0.995; Coulter Counter® R2 = 0.998), each device was less accurate at higher concentrations. For the Scepter™ cell counter, this result may be partially due to the fact that at higher concentrations, a small part of the histogram peak was not detected and cut off, leading to underestimation of the cell count. The precision in counting was determined by calculating the coefficients of variation (%CV) at each data point (Table 1). Overall, the two instruments demonstrated equivalent performance.
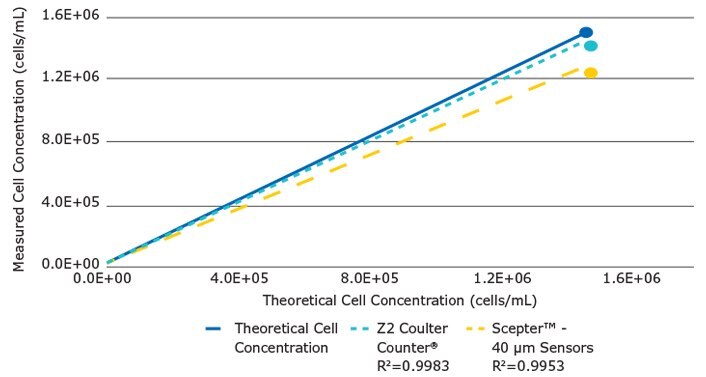
Figure 4.For Scepter™ cell counter and Z2 Coulter Counter® measured yeast cell concentrations are plotted against the theoretical concentrations. The solid line represents the theoretical values. For each device, the dotted lines represent best linear fit to seven data points. Both platforms show a loss of linearity and counting accuracy with the increase in cell concentration.
The Scepter™ cell counter’s ability to accurately determine particle size comes from the precise diameter of the sensor’s laser-drilled aperture. The 40 µm tip is capable of accurately measuring particles in the 4–16 µm range. Budding yeast (S. cerevisiae) are roughly spherical in shape with a diameter of 5-10 µm. To assess the accuracy of the Scepter™ cell counter in reporting yeast cell size, we compared cell diameters measured at the various sample dilutions (Figure 5). Overall, little variability was found in the measured size on either device (overall size ranges: Scepter™ 6.00–6.30; Z2 Coulter Counter® 5.92–6.41). However, for each device, we consistently found a slight size increase with increasing cell concentration on both platforms.
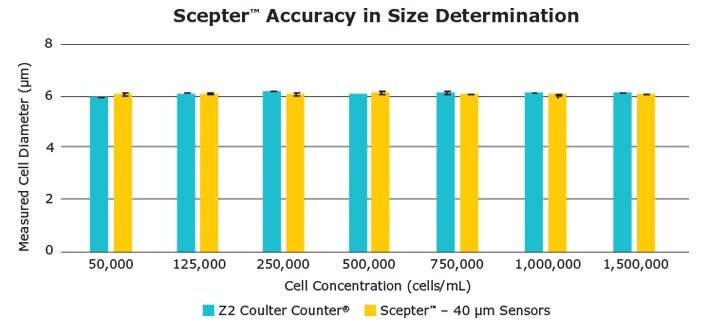
Figure 5.A range of yeast cell concentrations (5x10⁴ – 1.5x10⁶) was counted on the Scepter™ and Coulter Counter® devices. Error bars represent standard deviation of 4 replicate measurements. Results demonstrate the accuracy and reproducibility of both methods in size determination.
Summary
As a tool for the brewing industry, the Scepter™ cell counter provides an inexpensive alternative with comparable performance to other automated cell counting instruments for critical yeast quantitation. This performance quality, combined with the Scepter™ cell counter’s handheld and intuitive format, suggests that the Scepter™ cell counter is well-suited for the daily workflow of the brewing process, and can help ensure reproducibility of fermentation from batch to batch and over time.
As a testament to the utility of Scepter™ counting in the brewing industry, a spokesperson for the renowned Sinebrychoff Brewery in Finland (part of the Carlsberg Group) described the methods leading to the brewery’s successful use of the Scepter™ cell counter:
“We use the Scepter™ automatic cell counter to determine the number of yeast cells in our pitching yeast. Depending on the brewing yeast strain and the present condition of the yeast, the cell number count may vary. In general, the yeast sample has to be diluted 1:50,000; we use physiological saline as diluent. We used Auto gating method with 40 μm sensors, the range of measured particles were between 3 – 10 μm. The cell number in pitching yeast is used to monitor trends. The Scepter™ cell counter is very fast and easy to handle, so it saves a lot of time counting yeast cells. Also, as the Scepter™ cell counter gives very linear results, this means we can get consistent counts from person to person. In addition, the portability of the Scepter™ cell counter facilitates the counting.”
如要继续阅读,请登录或创建帐户。
暂无帐户?