Analysis of Tetrahydrocannabinol (THC) and Carboxytetrahydrocannabinol (THCCOOH) in Surface Waters by SPME and GC/MS
Katherine K. Stenerson
Reporter US Volume 34.1
Introduction
Cannabis is a schedule 1 substance under U.S. federal law. However, four states, Colorado, Washington, Alaska, and Oregon, have legalized it for recreational and medical use. The level of use by the general public is typically determined through questionnaires and crime statistics; however, this may not give an accurate assessment. Sewage epidemiology seeks to correlate data from these surveys with actual levels found in wastewater. In the case of cannabis, this can be done by analyzing for the psychoactive substance, tetrahydrocannabinol (THC), and its major metabolite, carboxytetrahydrocannabinol (THCCOOH).
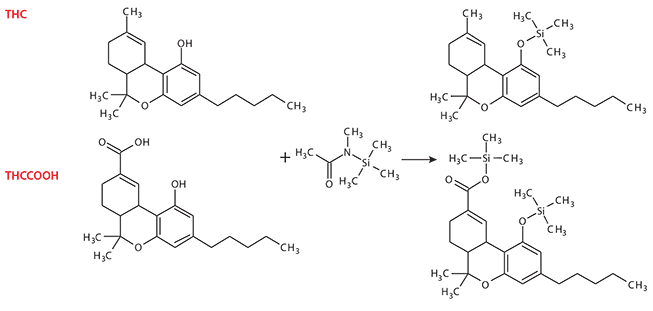
THC can be analyzed by GC directly, but because THCCOOH contains an acid group in its structure it requires derivatization. Thus, if the two compounds are analyzed together, derivatization must be used. Silylation can be used to produce GC-stable derivatives of both THC and THCCOOH. In this application, N-methyl-N-(trimethylsilyl) trifluoroacetamide (MSTFA) was used to derivatize both compounds by replacement of the active hydrogens in the OH ad COOH groups with trimethylsilyl (TMS) groups (Figure 1).

Figure 1. Silylation of THC and THCCOOH using MSTFA
Solid phase microextraction (SPME) can be used to extract both THC and THCCOOH from water, offering distinct advantages over solid phase extraction (SPE):
- Organic solvents are not required
- It is more easily automated
- It requires less hands-on sample preparation time
- It is highly sensitive
Analyte derivatization can be incorporated into an SPME procedure following two approaches: by derivatizing the analytes in the matrix and extracting the derivatives, or by derivatizing the analytes on the SPME fiber. The latter method was chosen for the application described here with derivatization done post extraction by exposing the fiber to the headspace above the derivatization reagent. In the application described here, derivatization was done post-extraction by exposing the fiber to the headspace over MSTFA.
Experimental
The final SPME and GC/MS methods are listed in Tables 1 and 2. Quantitation of samples was done using m/z 371 for both THC and THCCOOH. This was the most abundant ion in the spectra for the TMS derivatives of both compounds. Responses were calculated relative to internal standards THC-D3 and THCCOOH-D3 using m/z 374 for both. Final quantitation was done against calibration curves prepared in deionized water at pH 2. The standards covered a concentration range from 5 to 100 ng/L.
Results and Discussion
Optimization of SPME and Derivatization Methods
The SPME method used was based on previously published work.1 Adjusting the sample to pH 2 was necessary to obtain response for THCCOOH. At neutral pH, there was little to no uptake of the compound by the SPME fiber. THC, however, extracted well at pH 2 and neutral pH. The SPME fiber used was a 2 cm DVB/CAR/ PDMS, which offered greater sample capacity than the more commonly used 1 cm version and gave higher peak response at lower analyte levels.
Previous work indicated long equilibration times on the SPME fiber were expected for THC and THCCOOH based their high molecular weights and hydrophobicity.1,2 An extraction time had to be chosen that would balance both sensitivity and lab productivity. If THC and THCCOOH were present in the surface water samples, the levels were expected to be very low. Thus, detection at low ng/L levels was essential. For an 8 mL sample size, a 60 minute extraction time provided sufficient sensitivity for both compounds at levels below 10 ng/L.
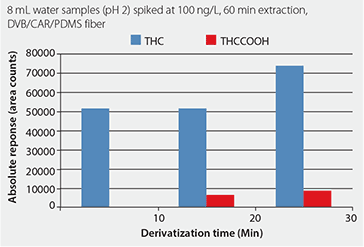
Silylation reactions are sensitive to the presence of water. The derivatization had to be optimized to compensate for any water present on the fiber after extraction. For this reason, a 10 mL vial containing 500 μL of MSTFA was used to provide sufficient concentration of derivatization reagent in the headspace. Derivatization time was then studied from 10 to 30 minutes (Figure 2). The responses of both compounds increased with time; however, derivatization time was limited to 30 minutes in order to keep the total sample preparation time to a reasonable length.
Due to the strength of the carboxen adsorbent in the DVB/CAR/PDMS fiber, a post-bake was used after desorption to prevent sample carryover. The maximum operating temperature of the DVB/CAR/PDMS fiber (270 °C) was chosen as the post-bake temperature. Ten minutes post-bake time was sufficient to limit carryover. This was monitored with fiber blanks throughout the course of data collection. Carryover of the TMS derivative of THC was typically in the range of 0.1%, while no carryover for THCCOOH was detected.

Figure 2. Effect of Derivatization Time on Analyte Response
Method Linearity and Detection Level
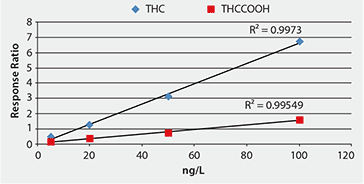
The method showed good linearity for water samples in the range of 5 to 100 ng/L, with r2 values >0.95 for both compounds (Figure 3). A determination of the detection level of the SPME method was done using a set of deionized water samples spiked at 10 ng/L with THC and THCCOOH (n = 8). The results of the study are summarized in Table 3. Accuracy was >95% and precision (measured as relative standard deviation, or RSD) was <20% for both compounds. The limits of detection and quantitation (LOD, LOQ) were calculated using the standard practice for environmental methods: LOD, the standard deviation times the Student’s t value (99% confidence level), and LOQ, ten-times the standard deviation.3 LOD values were <5 ng/L for both compounds and LOQ values were 11 and 14 ng/L for THC and THCCOOH, respectively. At the time of this writing there are no established maximum contaminant levels for these compounds in surface water; however, the LODs were in the range of those previously reported for these types of samples.1

Figure 3. Method Linearity, 5 to 100 ng/L (Internal Standard Corrected)

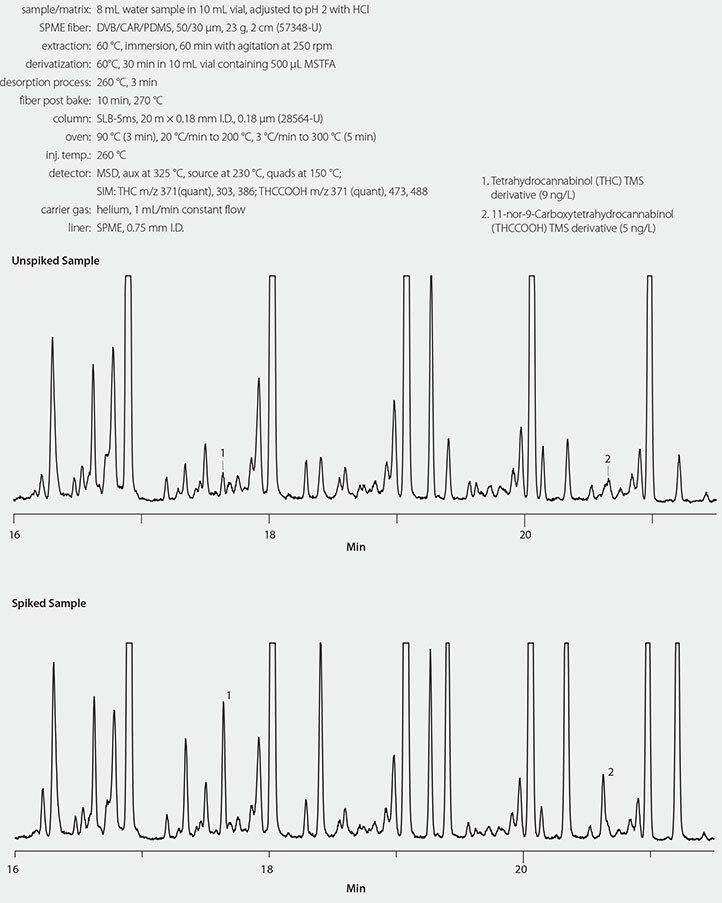
Figure 4. Surface Water Set #1. Treated Effluent from Water Treatment Facility
Analysis of Environmental Water Samples
Samples of surface water were collected at sites in two different U.S. states, one where marijuana use is legal, and one where it is not. The first set of surface water samples was from a state where marijuana use is legal. Sampling was done in an area of a creek that receives discharge of treated effluent from a wastewater treatment facility that serves a major university. Samples were collected at two different sampling spots and tested in duplicate. A 50 ng/L matrix spike and matrix spike duplicate were prepared from one of the sample sets. The results are summarized in Table 4. THC was detected in samples from both sites. The level found was technically below the calculated LOQ of the method, but reproducibility was very good which indicates an accurate measurement. THCCOOH was detected in both samples from site #1, but the level was too low to obtain accurate quantitation. It was not detected in both samples from site #2, and thus is not reported. The MS/MSD results showed good reproducibility and accurate measurement of the levels spiked.
The second set of surface water samples was from a state where marijuana use is currently not legal. Sampling was done in a drainage basin adjacent to a major university. Samples were collected at two sampling spots and tested in duplicate, with the matrix spike and matrix spike duplicate created from one of the sets. The results are summarized in Table 5. THC was detected just above the LOD in one of the sample sets, but reproducibility of the measurement was poor. The metabolite THCCOOH was not detected in either sample set. The MS/MSD tested with the samples was spiked at 10 ng/L for both compounds. The measurement accuracy at this level was >90%, with good reproducibility (<10% RPD).
*RPD, Reproducibility of two measurements; MS/MSD, matrix spike and matrix spike duplicate, spiked at 50 ng/L. +Amount reported after sample subtraction.
*RPD, Reproducibility of two measurements; MS/MSD, matrix spike and matrix spike duplicate, spiked at 10 ng/L. +Amount reported after sample subtraction.
Conclusions
SPME with on-fiber derivatization can be used for simultaneous analysis of THC and the metabolite THCCOOH. The detection limit from water was 3-4 ng/L for both compounds with a quantitation limit of 10-15 ng/L. When applied to surface water samples, the method was able to detect both THC and THCCOOH at low ng/L levels. The method requires minimal hands-on time, and is cost effective with minimal waste in that it does not require the use of organic solvents or single-use extraction cartridges. In addition to THC and THCCOOH, the SPME method could possibly be extended to include additional cannabinoids.
References
如要继续阅读,请登录或创建帐户。
暂无帐户?