ADCC Protocol using BioIVT Cryopreserved NK Effector Cells
- Tips and Tricks
- Materials for Antibody-dependent Cellular Cytotoxicity (ADCC)
- Instrumentation
- ADCC Protocol Using Cryopreserved NK Effector Cells
- ADCC Data Analysis
Antibody-dependent cell cytotoxicity (ADCC) assays are frequently used in immunological studies, oncology research, and the development of therapeutic antibodies. The use of cryopreserved effector cells in ADCC assays can provide a convenient, ready-to-use alternative to freshly isolated or cultured effector cells. We have optimized a protocol for ADCC assays using cryopreserved NK effector cells from BioIVT. The optimized protocol with recommended adaptations is provided below. For data and information on the performance of the assay, please refer to our technical article “ADCC assay using cryopreserved NK cells” .
Tips and Tricks
Before you start, there are several key points to be considered:
- Make sure the target cells express enough target antigen on their surface. This can be assessed using flow cytometry (preferred) or western blotting.
- For adherent target cells, make sure uniform distribution of target cells can be achieved reproducibly. It is recommended to use tips and tricks indicated on this protocol (see Figure 2) to ensure uniform distribution.
- If using a humanized antibody, IgG1, IgG3, or IgG1fut (defucosylation of the Fc region’s glycan sequences) often yield better results.1-3
- Ensure the antibody to be used for ADCC can bind the target antigen of interested using flow cytometry.
- In this protocol, frozen (cryopreserved) NK cells were used as effector cells. This required a 24-hour killing time.
- Plan the experiment before you start. Design a clear and detailed plate map (see Figure 1). The following parameters should be considered:
- Seeding density of the target cells: We recommend starting with 2,000-5,000 target cells/well in a 96-well plate.
- Ratio of effector to target cells (E:T): ADCC assays will always work better with higher E:T ratios. However, the availability of NK cells should be considered, as increasing the E:T ratio will require more NK cells. We recommend testing E:T ratios between 2:1 and 20:1.
- Antibody titration: We recommend testing antibodies at concentrations from 1 pg/mL to 1 µg/mL.
- When using cryopreserved NK cells, remember that cells cannot be re-frozen after thawing. Therefore, check that you will have the proper amount of cells in each vial and sufficient vials for your assay when ordering. In general, we recommend ordering three vials (5 million cells/vial) from three different donors to establish the feasibility of the assay and to assess donor-to-donor variability.
- Make sure to order NK cells from donors that have plenty of stock ready for purchasing. Consider ordering a large amount of NK cells from one single donor for repeats or future experiments.
- In general, a robust ADCC assay will yield greater than 50% killing when using frozen NK cells.
- If needed, further optimization of ADCC assay can include IL-15 to pre-treat the NK cells.
Materials for Antibody-dependent Cellular Cytotoxicity (ADCC)
- Cell culture media
- For A549 cell culture: Reconstituted F-12 Ham (Kaighn’s modification, N3520) with 10% FBS (ES-009-B), 1X Pen-Strep (TMS-AB2-C), and 2 mM L-glutamine (TMS-002-C).
Caution: Add NaHCO3 to a final concentration of 2.5 g/L prior to filtration. - For NK cell culture: RPMI-1640 (R8758) with 10% FBS (ES-009-B), 1X Pen-Strep (TMS-AB2-C), and 2 mM L-glutamine (TMS-002-C).
- For A549 cell culture: Reconstituted F-12 Ham (Kaighn’s modification, N3520) with 10% FBS (ES-009-B), 1X Pen-Strep (TMS-AB2-C), and 2 mM L-glutamine (TMS-002-C).
- DPBS (TMS-012)
- Trypsin-EDTA solution (T3924)
- 0.4% Trypan-Blue solution (T8154)
- BioIVT Frozen Human Normal CD56+ NK Cells, Negatively selected, HLA typed (HUMANHL56-0002824)
- A549 luciferase expressing cell line
- Anti-EGFR (Creative Biolabs #HPAB-AP066-YC)
- Disposable hemacytometer (MDH-2N1)
Instrumentation
- Titer Plate Shaker (LAB-LINE Instruments 4625)
- Plate reader (BioTek Synergy H1)
ADCC Protocol Using Cryopreserved NK Effector Cells
Day 1
Target cell preparation (Timing: 2 h):
- Grow A549 luciferase-expressing cells in T-75 flask (target cells, <75% confluency)
- Remove the medium and quickly wash the cells in the flask with 10 ml DPBS.
- Add 3 mL of Trypsin-EDTA solution to the cells; incubate at 37 ˚C for 5 mins.
- Add 7 mL of F12K medium into the flask. Pipette up and down several times to flush the cells on the culture surface and resuspend well.
- Count cells using hemacytometer.
- Spin down cells (300 x g for 3 min) and resuspend into F-12K medium at 5K cells/240 µL.
- Add 240 µl of cell suspension into each well, in a black 96-well plate (flat, clear bottom).
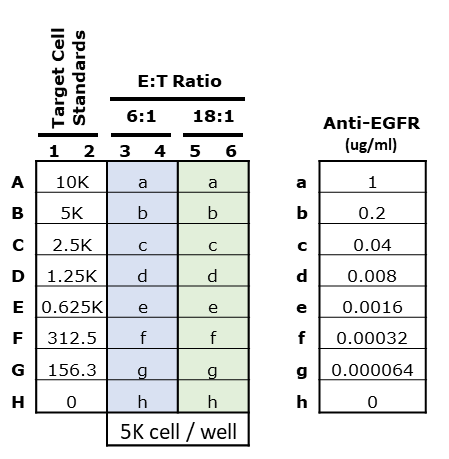
- Recommendation: For a target cell standard curve, prepare a suspension of 10K cells/240 µL. Then prepare 1:1 serial dilutions (5K, 2.5K, 1.25K, 625, 312, 156 cells/240 µL/well) in F12K medium, in duplicate

Figure 1.Sample plate map including target cell numbers, effector-to-target cell (E:T) ratios, and anti-EGFR concentrations.
- Critical Step: Rest plate in tissue culture hood for 1 hour before moving to 37 ˚C incubator for overnight incubation. The target cells should be evenly distributed on the bottom of the well (Figure 2). *This is critical for NK cell killing. If an uneven distribution is observed, re-plate starting at step 1.

Figure 2.Distribution of A549 cells plated in 96-well plate and incubated at room temperature for 1 hour. The picture was taken from the edge (A) and middle (B) part of the well using a Millicell® DCI Digital Cell Imager. An even distribution of cells should be observed throughout the well, without any aggregation of cells (particularly at the edges of the well).
NK cell preparation (Timing: 1 h):
- Thaw one vial of cryopreserved NK cells in a 37 ˚C water bath for 2 mins.
- Pipette the cell solution into a 50 mL centrifuge tube.
- Drop by drop, add 5 mL of warmed RPMI-1640 medium.
- Pipette 10 µL of NK cell suspension into a 1.5 mL Eppendorf® tube. Add 10 µL of 0.4% Trypan-Blue solution and mix well.
- Pipette 10 µL of mixture to hemocytometer; count cell number and viability.
- Spin down the NK cells (300 x g for 3 min).
- Resuspend NK cell pellet at 1M live cells/mL in RPMI. Move the cells to flask/well-plate by total volume.
- Optional: Resuspend the NK cells in RPMI-1640 with proper concentration of IL-15, if desired.
- Incubate NK cells at 37 ˚C overnight.
Day 2
Killing reaction (Timing: 2 h):
- Pipette 10 µL of NK cell suspension into a 1.5 ml Eppendorf® tube. Add 10 µL of 0.4% Trypan-Blue solution and mix well. Count the number of live NK cells.
- Spin down NK cells (300 x g for 3 min) and resuspend at desired cell concentration in RPMI-1640 according to the Effector:Target cell ratio.
Example: The designed E:T is 6:1. Since there are 5K target cells in each well, the NK cells should be resuspended at 30K live cells/120 µL per well.
- Aspirate the medium from wells of the target cell plate with 8-channel manifold (Drummond 3-000-093).
Caution: Do not let the tips of the manifold touch the bottom of the wells. - Add 120 µL of NK cells to each well for killing.
- Prepare 2X concentration of anti-EGFR antibody solution in RPMI-1640.
Example: The designed anti-EGFR concentration is 1 µg/mL; prepare at 2 µg/ml with RPMI-1640.
Recommendation: Prepare 2 µg/mL antibody solution first, then prepare 1:4 serial dilutions (400, 80, 16, 3.2, 0.64 and 0.128 ng/mL) so that the final concentration of antibody in the wells will be 1000, 200, 40, 8, 1.6, 0.32 and 0.064 ng/mL (Figure 1)
Critical Step: NK cells should be added to the well prior to antibody to avoid endocytosis of the by the target cell.
- Add 120 µL anti-EGFR to each well (final well volume: 240 µL).
- Add 240 µL of RPMI-1640 to the wells prepared for target cell standard curve.
- Incubate the plate at 37 ˚C overnight.
Critical Step: When using cryopreserved NK cells as the effector cell, it is important to optimize killing duration. In general, while ADCC assays using fresh NK cells can be completed within 6 hours, ADCC assays using the cryopreserved NK cells will require overnight incubation to generate sufficient killing.
Day 3
Measure luminescence (Timing: 2 h):
After 24 hours, target cell death should be observable using a microscope (Figure 3)

Figure 3.NK killing of A549 target cells, mediated by anti-EGFR, after 24 hours incubation. The E:T ratio was 18:1. The concentration of anti-EGFR antibody was 1 µg/mL (A) using a 0 µg/mL anti-EGFR antibody control (B). Clear killing of target tumor cells was observed in the presence of antibody as seen by cellular detachment and clamping of dead cells and debris. In contrast, target tumor cells appear healthy with a complete monolayer in absence of anti-EGFR antibody. Images were taken using a Millicell® DCI Digital Cell Imager.
- Warm RPMI-1640 medium to room temperature.
- Warm SCT150 lysis buffer and D-luciferin stock solution to room temperature
- Add D-luciferin stock to the lysis buffer at a final concentration of 0.25 mg/mL.
- Aspirate the medium from wells of the target cell plate using an 8-channel vacuum manifold. Do not let the tips of the manifold touch the bottom of the wells.
- Add 50 µL RPMI-1640 medium to each well.
- Add 50 µL SCT150 lysis buffer with luciferin to each well.
- Shake the plate on Titer Plate Shaker (LAB-LINE Instruments #4625) for 10 mins, while ensuring no liquid spill over. Ensure all the cells are lysed (if needed, this can be confirmed by observing under a microscope).
- Measure luminescence using a plate reader. Ensure measurements are within the linear range of the assay.
Caution: The luminescence signal will be reduced dramatically after 10 mins. If analyzing multiple plates, do not lyse plates together. In addition, ensure each plate has its own cell standards and that luminescence measurements fall within the linear range of the cell standards. In cases where luminescence measurements fall outside of linear range, curve fitting should be used to convert signal into actual cell numbers.
ADCC data analysis
Data can be plotted three ways:
- Raw (luminescence) signal vs. concentration of anti-EGFR antibody at various effector-to-target cell (E:T) ratios
- Percent cytotoxicity vs. concentration of anti-EGFR antibody at various E:T ratios, using the following equation for cytotoxicity:
Cytotoxicity % = [(Max-BG) - (Expt-BG)] / (Max-BG) * 100
where Max represents the average signal from target cells only, Background (BG) represents the average signal from wells with
no target cells, and Expt denotes experimental samples. - Percent ADCC vs. concentration of anti-EGFR antibody at various E:T ratios, using the following equation for ADCC:
ADCC % = Cytotoxicity % (with antibody) – Avg (Cytotoxicity % (without antibody))
Live cell numbers can be interpolated using luminescence signal from a standard curve of A549 cells expressing the luciferase reporter gene.
Plotting raw signal vs. concentration antibody

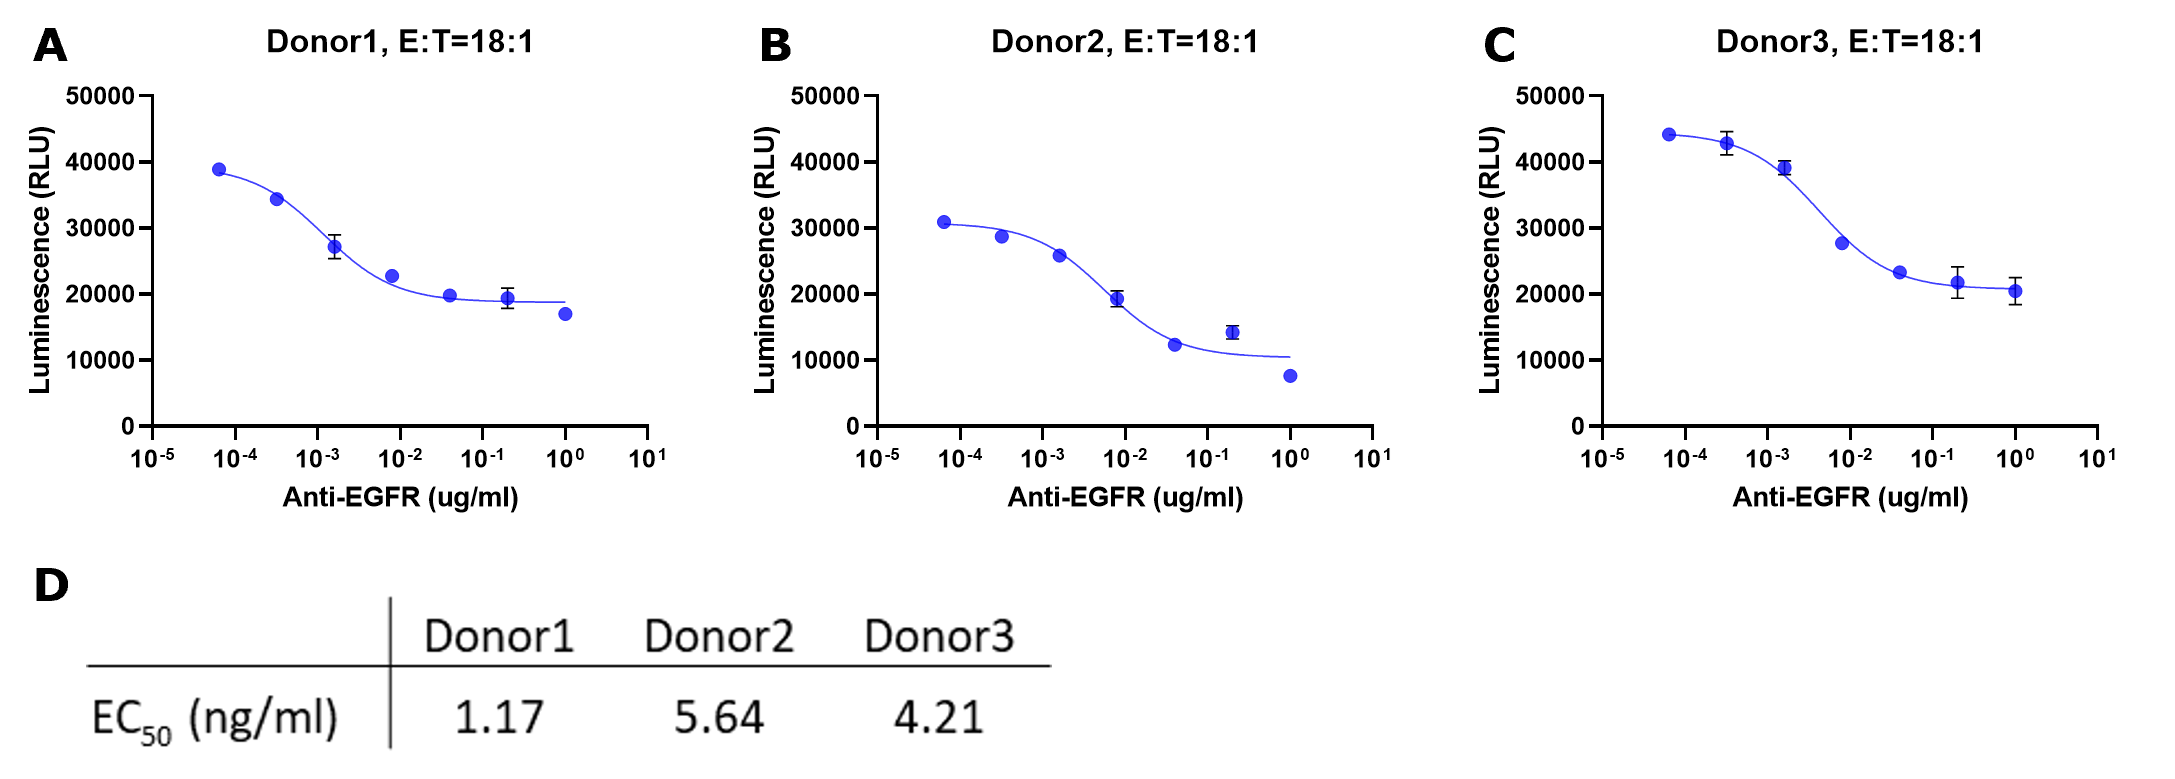
Figure 4.Representative data for ADCC assay with serial titration of anti-EGFR antibody. The NK cells isolated from three donors (A, B and C) were incubated with luciferase-expressing A549 target cells with increasing concentrations of anti-EGFR antibody for 24 hours. For all experiments, the E:T was 18:1. Luciferase activity in surviving target cells was determined by luminescence measurement. The raw luminescence data were fitted to a sigmoidal three-parameter curve. EC50 values were obtained using following formular: Y=Bottom + X*(Top-Bottom)/(EC50 + X) (D). ! Caution: Both ends of the curve should be flat, indicating a reaction close to minimum / maximum response. This is critical for deriving an accurate EC50 for the reaction. If the slope is still steep, consider repeating the experiment using a lower or lower antibody concentration as appropriate.
Plotting percent cytotoxicity vs. concentration antibody
Cytotoxicity % = [(Max-BG) - (Expt-BG)] / (Max-BG) * 100
where Max represents the average signal from target cells only, Background (BG) represents the average signal from wells with
no target cells, and Expt denotes experimental samples.

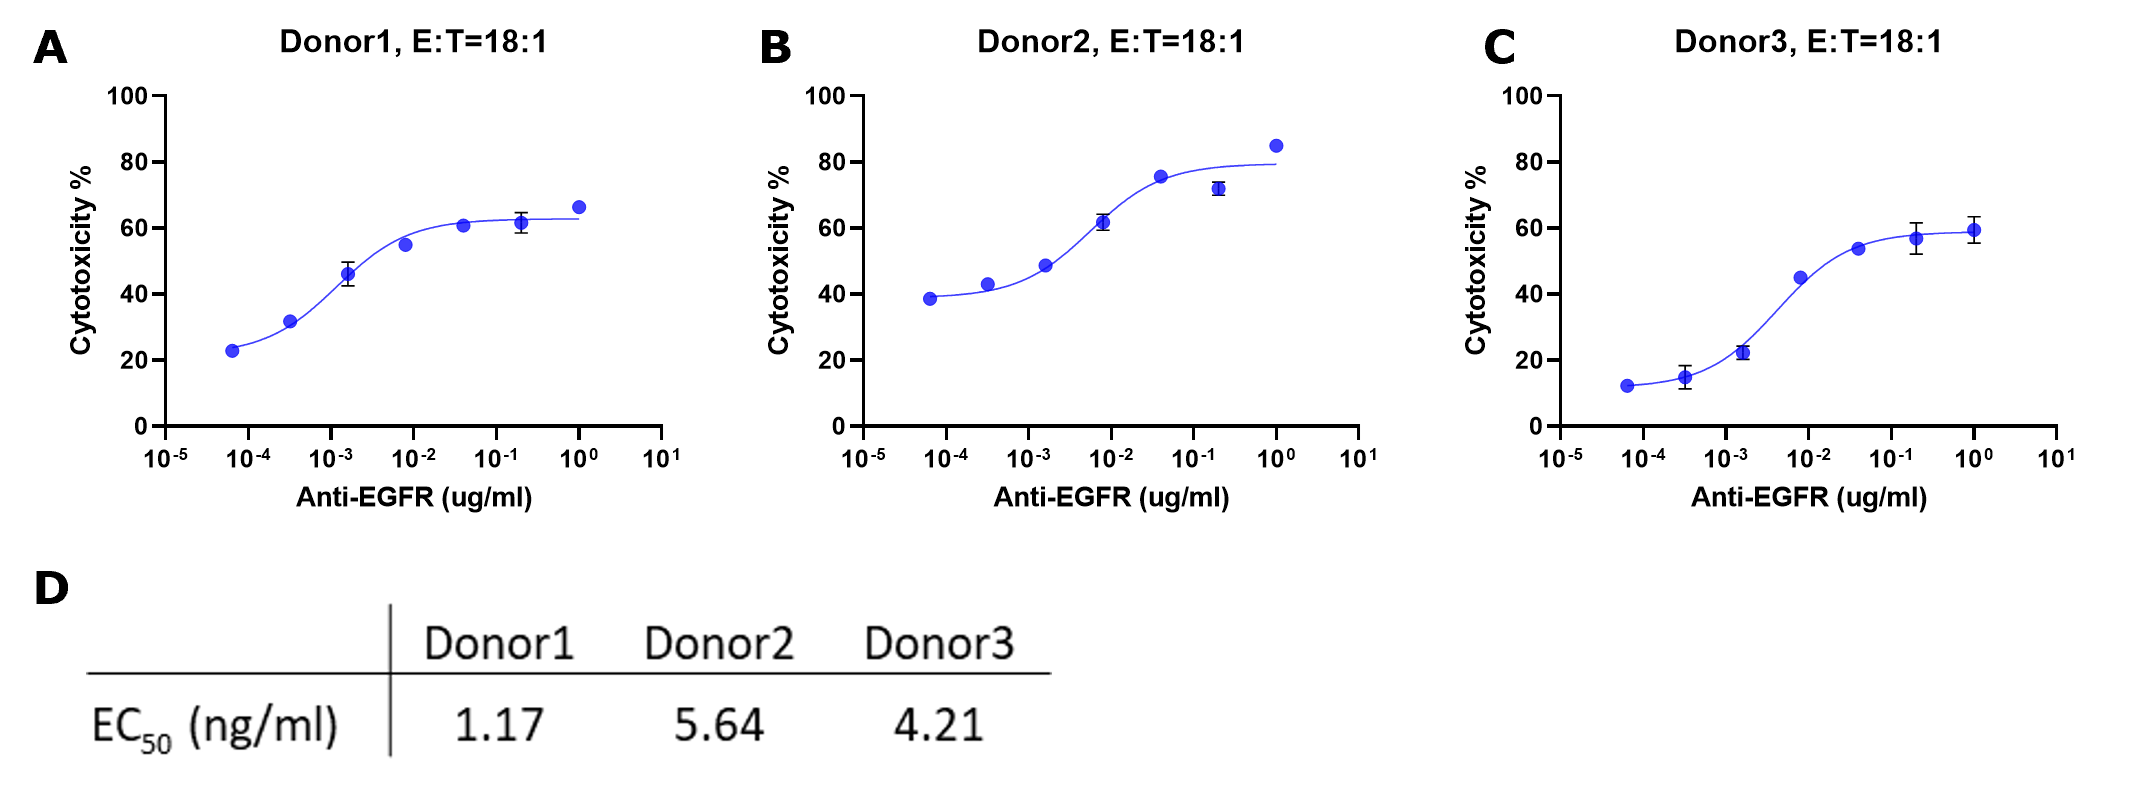
Figure 5.Cytotoxicity % for each sample were fitted to a sigmoidal three-parameter curve. EC50 values were obtained using following formular: Y=Bottom + X*(Top-Bottom)/(EC50 + X) (D). EC50 values match those obtained from plotting raw luminescence signal vs. antibody concentration (Figure 4D).
Plotting percent ADCC vs. concentration antibody
ADCC % = Cytotoxicity % (with antibody) – Avg (Cytotoxicity % (without antibody))

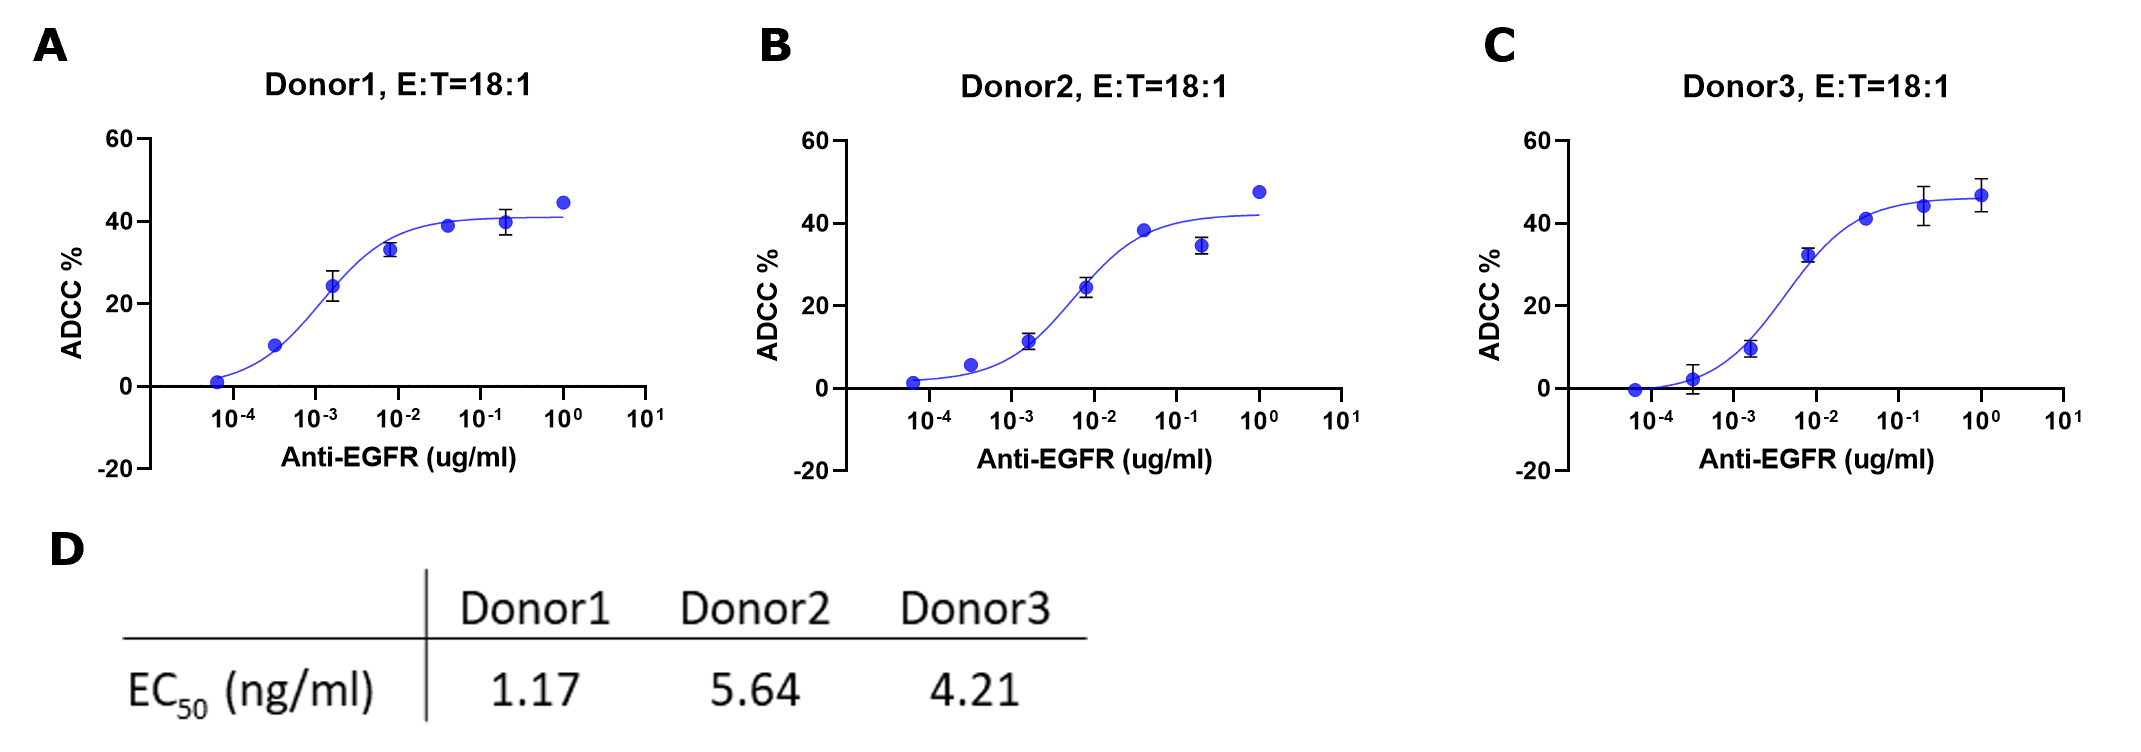
Figure 6.ADCC % for each sample were fitted to a sigmoidal three-parameter curve. EC50 values were obtained using following formular: Y=Bottom + X*(Top-Bottom)/(EC50 + X) (D). EC50 values match those obtained from plotting raw luminescence signal vs. antibody concentration (Figure 4D).
References
To continue reading please sign in or create an account.
Don't Have An Account?