Validation of RNAi Knockdown Using Multiple Reaction Monitoring and Protein-AQUA™
Beth K. Radwanski, Shantanu Roychowdhury, Henry Duewel
Introduction
The field of proteomics is continually looking for new ways to investigate protein dynamics within complex biological samples. Recently, many researchers have begun to use RNA interference (RNAi) as a method of manipulating protein levels within their samples, but the ability to accurately determine these protein amounts remains a challenge. Fortunately, over the past decade, the field of proteomics has witnessed significant advances in the area of mass spectrometry. These advances, both in instrumentation and methodology, are providing researchers with sensitive assays for both identification and quantification of proteins within complex samples. This discussion will highlight some of these methodologies, namely the use of Multiple Reaction Monitoring (MRM) and Protein-AQUA.
MRM is a rapidly growing technique used for peptide quantitation. The utility of the technique lies in the increased sensitivity and selectivity of the instrument to monitor specific peptide ions that have undergone a particular fragmentation reaction. In this technique, the sample is introduced into a triple quadrupole mass analyzer, in which the sample is ionized and undergoes two stages of mass selection. The first stage occurs in quadrupole 1 (Q1), where a peptide of a given molecular weight (the precursor ion) is selected. The precursor ion then undergoes fragmentation in the collision cell (q2) to form fragment ions. The second stage takes place in the third quadrupole (Q3), where a specific fragment ion is selected. Because peptides fragment in a predictable manner, the selected fragment ion will be specific to the peptide of interest. Collectively, this generates a Selected Reaction Monitoring (SRM) assay that is highly specific and sensitive for the selected peptide producing a chromatographic peak that can be integrated in a standard LC-MS experiment. When several of the precursor to fragment ion assays are performed in parallel, this is known as Multiple Reaction Monitoring.
Protein-AQUA (Absolute QUAntification1) utilizes isotopically labeled synthetic peptides as internal standards to quantitate the abundance of endogenous peptides. In this technique, protein amounts are determined by comparing the amount of an endogenous peptide to a known amount of a corresponding AQUA Peptide™. The heavy label on the AQUA Peptide causes a shift in the mass spectrum, which allows for easy comparison to the endogenous peptide. The combination of Protein-AQUA with MRM demonstrates a powerful and reliable method for absolute quantitation of peptide and protein concentration.
In the present work, Protein-AQUA and Multiple Reaction Monitoring were used to validate and quantify the siRNA-mediated knockdown of glyceraldehyde 3-phosphate dehydrogenase (GAPDH) in Human Cervical Adenocarcinoma (HeLa) cells. Two AQUA peptides were synthesized and used as internal standards in LC-MRM experiments to quantitate the corresponding endogenous GAPDH peptides derived from tryptic digestion of lysates prepared from HeLa cells treated with various concentrations of GAPDH specific siRNA.
Materials and Methods
Cell Culture
Human Cervical Adenocarcinoma (HeLa) cells were grown in Dulbecco’s Modified Eagle’s Medium (DMEM , D6429) with high glucose and supplemented with 4 mM L-glutamine and 10% Qualified Fetal Bovine Serum (F4135). These cells were transfected with a siRNA specific to Human GAPDH or a non-coding siRNA control using the N-TER™ Nanoparticle siRNA Transfection System (N2913). The siRNAs and the N-TER system were obtained from MilliporeSigma (The Woodlands, TX). The siRNA / N-TER complexes were diluted into final concentrations of 5, 10 and 15 nM siRNA. A mock transfection was performed with N-TER reagents alone (no siRNA) as well as with 15 nM of the non-coding siRNA. Following transfection, cells were cultured for an additional 24 hours prior to harvest. (Figure 1).
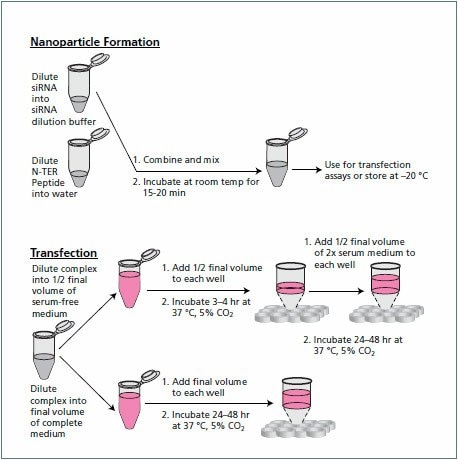
Figure 1.Nanoparticle formation. Overview of the N-TER Nanoparticle Transfection System.
The cells were harvested by dissociation with Trypsin/EDTA solution (T3924), following which the cells were collected by centrifugation, and suspended in HBSS containing Benzonase® Nuclease (E1014) to degrade chromosomal DNA. An equal volume of 8 M urea was added to the cells and incubated on ice for 30 minutes. The samples were clarified by centrifugation. The protein concentration was determined using Bradford Reagent (B6916).
Protein-AQUA
Two peptides to human GAPDH were selected and synthesized with the incorporation of >98% 13C, 15N labeled lysine (13C6, 15N2). Peptides were purified to >95% using C18 Reverse Phase-HPLC and quantitated by amino acid analysis (MilliporeSigma, The Woodlands, TX). Refer to Figure 2 for an overview of the AQUA procedure.
AQUA Peptide 1: GALQNIIPASTGAAK*
AQUA Peptide 2: VIPELNGK*
*Asterisks denote the heavy lysine.
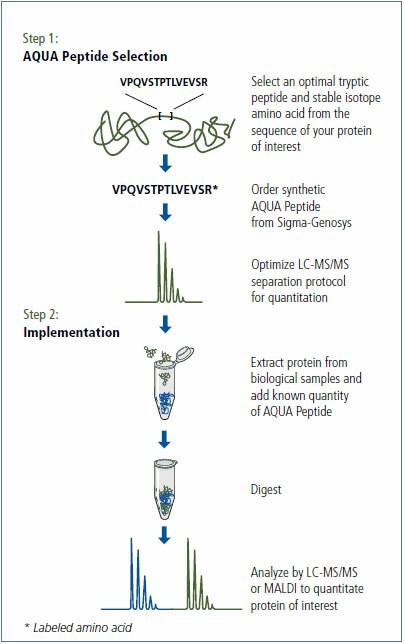
Figure 2. Overview of the Protein-AQUA method.
The samples (30 μg total protein) were reduced and alkylated using the ProteoPrep® Reduction and Alkylation Kit (PROTRA). The protein was concentrated via an acetone precipitation. Protein pellets were then suspended in 2 M urea, 40 mM ammonium bicarbonate pH 8.5, 9% acetonitrile and digested with trypsin (T6567). GAPDH AQUA peptides were spiked into 30 μg of digested untreated HeLa cell lysate at the following amounts to generate a standard curve: 50 pmol, 5 pmol, 500 fmol, 50 fmol, 5 fmol, and 0.5 fmol. Based on the results of the standard curve, siRNA transfected protein digests (30 μg total protein) were spiked with 5 pmol of each AQUA Peptide in a final volume of 30 μL of 0.1% formic acid (Figure 3).
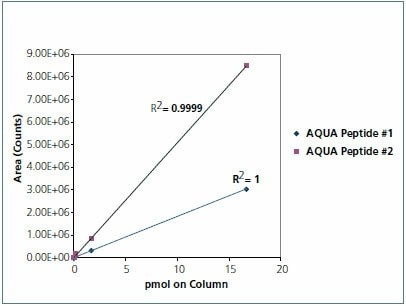
Figure 3.Standard curve of AQUA peptides in HeLa cell lysate matrix. Analysis of both of the AQUA peptides by LC-MRM indicates a linear response over 6 orders of magnitude. CV’s measured for 6 replicate measures of each Endogenous Peptide MRM transition revealed 3.31% for AQUA Peptide #1 and 2.31% for AQUA Peptide #2.
MRM Analysis
Samples were analyzed by LC-MRM using a Supelco Discovery HS C18 (568502-U) column on a Shimadzu Prominence® HPLC hyphenated with an ABI 4000 QTRAP Triple Quadrupole Analyzer equipped with a TurboV® (Electrospray) Ionization Source. The MRM transitions were determined using tandem MS scans (Figure 4). Chromatographic peak areas were determined using the Quantitation Wizard in Analyst® Software (Version 1.4.2) and data was plotted as Area versus AQUA spike. This data was used to determine the expression level of GAPDH (Figure 5). Analysis of the knockdown was confirmed by Western blot (Figure 6).
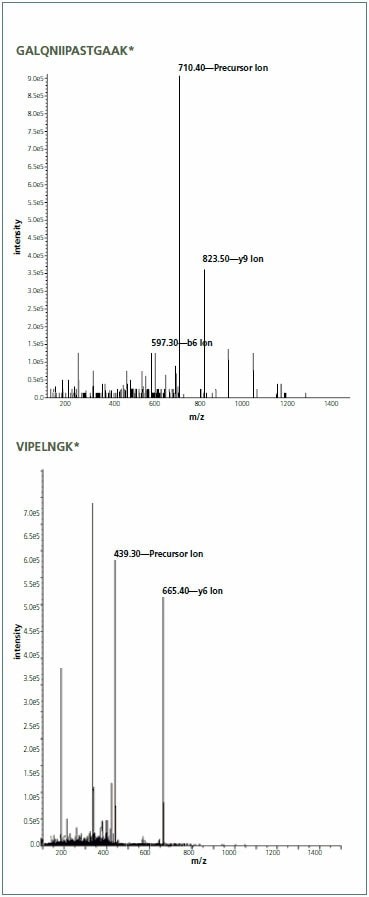
Figure 4.Multiple reaction monitoring (MRM) method development. Development of the method was performed by loop injection of 167 fmol of each AQUA Peptide into the Source. To determine fragmentation patterns, tandem MS scans were performed on each AQUA peptide optimizing the Collisional Energy. Endogenous peptides corresponding to each AQUA peptide displayed similar spectra. For AQUA Peptide #1, two fragment ions were chosen in order to determine specificity of the peptide.
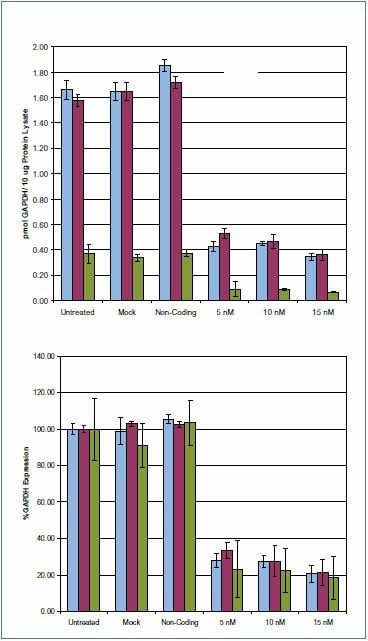
Figure 5.GAPDH protein expression levels from HeLa cell transfections. Expression of GAPDH 24 hours post transfection. Samples were analyzed by the LC-MRM procedure described in the Methods section. Two transitions were observed for AQUA Peptide #1, and one transition was observed for AQUA Peptide #2. For each of the three transitions measured, >70% decrease is observed on GAPDH siRNA transfected samples at the 5 nM level 24 hours post transfection relative to untreated. The trend indicates decreasing GAPDH expression levels with increased siRNA concentration. Data is representative of biological duplicates. Transition #1-GALQNIIPASTGAAK: 706.402+ - 815.501+ Transition #2-GALQNIIPASTGAAK: 706.402+ - 597.301+ Transition #3-VIPELNGK: 435.302+ - 657.401+
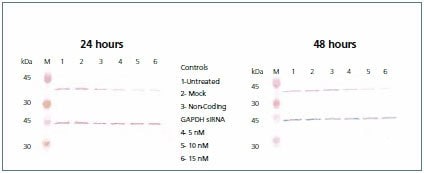
Figure 6.Western blot. A portion of the lysate containing 10 μg of total protein from each of the three controls (untreated, mock, and non-coding) and the GAPDH siRNA (5, 10, and 15 nM) transfected cells were resolved by SDS-PAGE and immobilized on nitrocellulose membranes. The membrane was probed with Anti-GAPDH (G9545), developed with TMB (T0565), stripped with 0.1 M glycine-HCl pH 2.0, and subsequently re-probed with Anti-b-Actin (A2228).
Summary
Through the combination of LC-MRM with Protein-AQUA, we were able to show a highly specific method for quantitating levels of GAPDH following RNAi knockdown, using representative target peptides. Mass spectrometric response was gauged by spiking known amounts of two AQUA peptides into a HeLa cell lysate. Excellent linearity (R2>0.99) was observed over 6 orders of magnitude for both peptides, with the lower limit of quantitation observed in the mid amol range. Two transitions for AQUA Peptide #1 were measured, yielding quantitation results that were in strong agreement with each other confirming the specificity of the peptide to GAPDH. Different absolute protein levels were observed for each AQUA peptide, which may result from differing digestion rates across various regions of the primary sequence. Further investigation in this area will require the use of additional peptides to GAPDH for LC-MRM analysis. While analyzing the level of GAPDH expression, similar levels of knockdown were observed for both the Western Blot and Protein-AQUA. The Western blot exhibits a visible decrease in signal for cells transfected with GAPDH siRNA, whereas there is no decrease in signal in the controls. This correlated well to the percent of GAPDH expression that was measured by the two AQUA peptides. The high specificity of this combined method shows great utility for protein quantitation in a complex sample.
To continue reading please sign in or create an account.
Don't Have An Account?