Serum Lipidomics Profiling using an Ascentis Express Fused-Core C18 Column
The following was generated with the assistance of an outside source using Sigma-Aldrich products. Technical content was generated and provided by:
Susan S. Bird and Bruce S. Kristal
Department of Neurosurgery, Brigham and Women’s Hospital and, Department of Surgery, Harvard Medical School, 221 Longwood Avenue, LMRC-322, Boston, Massachusetts 02115
Introduction
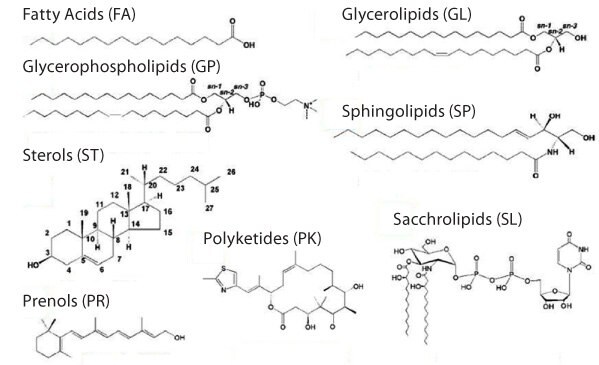
Lipid diversity in a given biological system is quite great as there are both charged and neutral lipids in addition to species of varying degrees of chemical polarity. The LIPID Metabolites and Pathways Strategy (LIPID MAPS) consortium (www.lipidmaps.org) has systematically defined and classified lipids into eight categories, with multiple subclasses of each covering both eukaryotic and prokaryotic sources (Figure 1).1 This standardization has assisted the progress in developing analytical methods for untargeted lipidomic profiling studies where all lipids are of potential importance and therefore require sensitive and robust detection.

Chromatographic separation of lipid extracts prior to mass spectrometric (MS) detection aids in the achievement of comprehensive, quantitative, and reproducible analytical data, in an efficient and robust manner. In the past, successful separation and analysis of lipids has been achieved using both gas chromatography (GC) and normal phase LC coupled to MS. These techniques, however, are not without limitations relating to what types of lipids are detectable and to the run-to-run reproducibility of the method.2,3 Reversed-phase (RP) LC is often the technique of choice due to its efficient separations and ability to interface easily with electrospray ionization-MS detection.4-7
The current study uses a Fused-Core® C18 RP-LC column to achieve lipid separations in biological samples. The Fused-Core technology offers more robust particle size distribution, in comparison to traditional porous particles, which allows for sharper peaks by minimizing the eddy diffusion through the column. Additionally, this type of particle has a reduced diffusion path which provides sharper peaks at higher flow rates, allowing for increased sample throughput.4
Lipidomic analysis of serum samples from a rat diet study (n=192) was analyzed using RP-LC-MS in order to achieve comprehensive lipid coverage, relative quantitation of lipid species between diets, and characterization of unknown lipids. The methods ability to reproducibly separate and detect 86 unique triglycerides, in addition to lipids from the other 6 categories found in plasma, will be highlighted.
Methods
Animal Study
Sets of male Fisher 344 x Brown Norway F1 (FBNF1) rats (n=8 per set), aged 7-9 weeks, were fed ad libitum one of 24 isocaloric diets that differed in fat and carbohydrate composition (total n=192).
Lipid Extraction and LC-MS Analysis
Lipid extracts were extracted from 30 µL of rat serum using a modified Bligh and Dyer liquid-liquid extraction and separated on an Ascentis® Express C18, 15 cm x 2.1 mm I.D., 2.7 µm column (53825-U) connected to a Thermo Fisher Scientific PAL autosampler, Accela quaternary HPLC pump, and an Exactive benchtop orbitrap mass spectrometer (Thermo Fisher, San Jose, CA) equipped with heated electrospray ionization (HESI) probe. The HPLC was run at 260 µL/min and the column was held at 550 °C. Mobile phase A consisted of 60:40 acetonitrile: water in 10 mM ammonium formate with 0.1% formic acid, and mobile phase B consisted of 90:10 isopropanol: acetonitrile also with 10 mM ammonium formate and 0.1% formic acid. Details of the LC-MS method and SIEVE analysis have been described previously.6,7
Results
Lipid Class Separation
Because many lipid species are isobaric, an understanding of the chromatographic retention time pattern can facilitate the identification and characterization of unknowns. The Ascentis Express reversed-phase C18 column separated lipids by both head group polarity and acyl side chain composition in an efficient manner, yielding sharp and robust peaks. Figure 2 shows representative total ion current (TIC) chromatograms of a serum sampled pooled from all 192 animals in our study. Sections of the chromatograms are labeled with the lipid categories detected, indicating the regions where each will elute using the LC-MS method. Highlighted in italics are some specific lipid classes which are found from those categories that are observed in the serum pool samples. The diverse nature of the serum lipidome suggested that comprehensive LC-MS profiling methods utilize both positive and negative ionization modes.
-separation/total-ion-chromatogram)-separation.jpg)
Triacylglyceride Separation
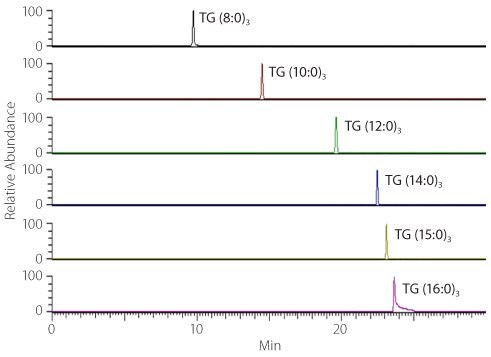
In the positive ion TIC (Figure 2) the majority of the signal is due to the highly abundant serum triglycerides (TGs). There is a growing understanding that there are TG species-specific implications for health;8 therefore, our priority was to identify all serum TGs found in our animal dietary macronutrient study. Identification was achieved by first analyzing a standard mixture of 6 TGs (TG (8:0)3, TG (10:0)3, TG (12:0)3, TG (14:0)3, TG (15:0)3 and TG (16:0)3), and determining the elution profile and retention time (RT) reproducibility of these species. From Figure 3, you can see that separation is based on acyl chain length. From repeat injections of these standards over 5 days, we determined the RT coefficients of variation to be < 0.3%. This experiment allows us to recognize regions in the chromatogram where we can expect the TGs to be found, noting that the biologically relevant TGs will contain longer acyl side chains and be located between 22-25 minutes.

Unknown Triacylglyceride Identification
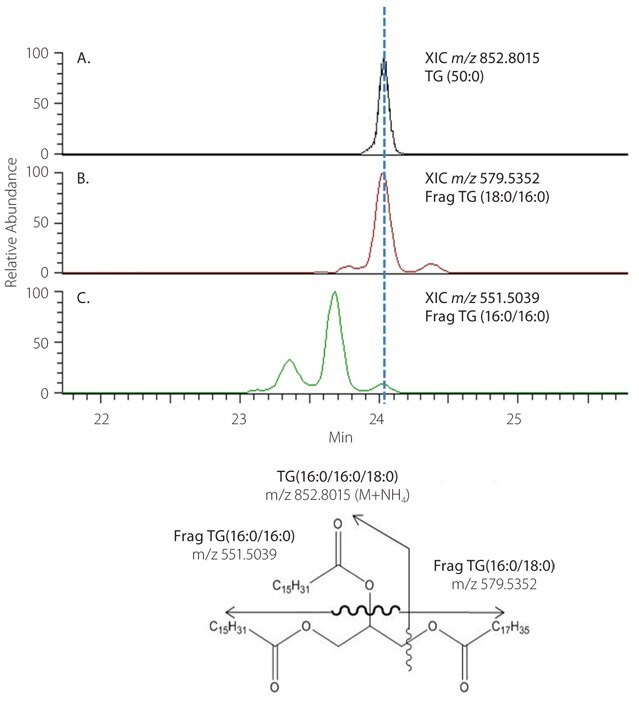
When analyzing our unknown rat serum data, exact mass measurement, and retention time pairs from SIEVE that fell into the predetermined regions of the chromatogram were searched through online databases for possible TG hits. All ion fragmentation MS was then used to fully characterize these hits. Extracted ion chromatograms (XIC) of the fragment and parent masses were aligned to determine the FA side chains on each TG molecule.
Figure 4 shows an example of this type of identification. A lipid with m/z 852.8015 found at RT 24.06 minutes, is found to match the mass of TG (50:0) as an [M+NH4]+ ion when searching the human metabolome database and yields two possible TG isomers. In panels B and C, the diacylglycerol fragments chromatographically align with the parent ion to confirm the structure as TG (16:0/16:0/18:0). We present the specifics on the MS studies involved in the characterization of TGs, in a recent paper in Analytical Chemistry.7
Conclusions
In a profiling LC-MS method, lipid separation is very important since it is natural for co-elution to occur when a large number of species elutes over a limited time period. In addition to identifying lipids from 6 major categories found in rat serum, this profiling method was able to identify 86 unique TGs, with 62 having their individual side-chains characterized. This is a significant improvement over past methods where not only were far fewer TGs identified; they were merely characterized by their total number of carbons and double bonds. This enhancement is a reflection of the added chromatographic resolution observed with the Ascentis Express Fused-Core column and the high resolution, accurate, mass detection of our MS system.

References
如要继续阅读,请登录或创建帐户。
暂无帐户?